The nineteen eighties saw Japan take its place on the global economic map as a power to be reckoned with. The world awoke and watched in awe that a nation once besought by the ravages of nuclear attacks could rise to such great heights of economic prosperity.
Japan emerged to overwhelm American companies, due to its ability to compete on price, aided by robots and cheap labor. With the exception of microprocessors, Japan dominated the market for all chips, circuit boards and other components. Additionally Japan became the world’s largest creditor and had the highest GDP per capita. Many Americans feared that their workforce would become obsolete due to the use of robots in Japan. According to the Bureau of Economic Analysis, Japan grew at an average annual rate (as measured by GDP) of 3.89% in the 1980s, compared to 3.07% in the United States.
In a sense, the polices followed for many years after the World war encouraging people to save, was instrumental in triggering the infamous “pent up demand”. With growth making available an increase of disposable incomes, risk taking emerged which unfortunately went into frenzy before staging a collapse. Real estate and equities became the most coveted asset class.
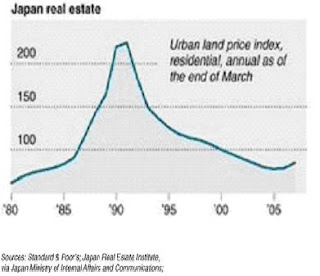
It is believed that in certain districts real estate valuations soared to over US$1.5 million per square meter. By 2004, prime "A" property in Tokyo's financial districts were less than 1/100th of their peak. Thus housing prices plummeted for 14 straight years as is evident in the chart 1 below
Chart 1
Coming to equities, as can be seen from the chart 2 below The Nikkei hit a high of 38,957 in Dec 1989 and ushered in a prolonged period of contraction.
Chart 2
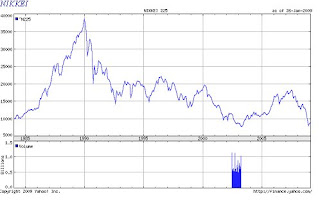
The index initially hit a low of 7606 on 28th April 2003, staged a bounce only to fall victim to the global financial crisis. It hit a 26-year low of 6994.90 in Oct 2008.Clearly the Nikkei episode goes down history as perhaps the longest bear innings a nation could have seen – one that has been intact for close to two decades now and still continues to extend!
Japanese Banks-
It is important to touch upon the banking system of Japan as it played a central role in making the problem systemic. Prior to 1985, banks in Japan were not permitted to pay interest on deposits. When this was reversed by a policy of interest rate deregulation, there emerged an unending competition between banks to garner deposits and this led to an increase in interest servicing commitments. However banks failed to correspondingly raise the cost of lending. The resultant gap in profit margins was plugged by the punting on the booming stock market. Whichever stock was picked yielded returns.
Another dimension to the banking failure can be highlighted thus. The Bank of International Settlements (BIS) which was advocating every bank to have capital to cover at least 8% of its liabilities, bent rules to accommodate Japanese banks. This they did by allowing even unrealized capital gains as on a reporting date to be treated as capital .This clearly violated the conventional rule wherein, only cash and completely liquid assets would count as capital.
Between 1987 and 1989 city banks issued nearly 6 trillion Yen of equity and equity-related securities. Things soured with the crash in 1990 and banks scurried to maintain the BIS required 8% capital ratio. The number of regional banks that could meet the 8 percent ratio declined from 50 in March of 1990 to 4 in September of that year.
One blunder only gave rise to further. Banks, which had adopted “keeping fingers crossed policy “ to hedge against downside risks were then permitted by the Ministry of Finance to issue junk bonds to remedy the banks capital problem
Apart from this, Japanese banks borrowed extensively in the Euro-dollar markets during the bubble period - an estimated 186 trillion Yen by June 1990.This was in turn used to finance a number of leveraged buyouts (LBO).
Banks also lent heavily with land as collateral and unfortunately did most of their lending in the peak of the real estate market and consequently suffered extensive losses when property values declined and loans went bad.
Yet another important observation pertains to the provisioning for NPA’s. In Japan banks were not only NOT required to establish reserves for bad loans, they are effectively penalized for doing so. Setting aside funds to cover bad loans would reduce the tax liability of the bank and so the banks had to obtain permission from taxing authorities to create bad loan reserves. Consequently in 1991 Japanese banks had reserves of only 3 trillion Yen for total loans of 450 trillion Yen.
Drawing Lessons……
It is widely believed (with the benefit of hindsight) that the Bank of Japan did not respond proactively in preventing the colossal wreckage. Even as equities fell, the BoJ continued to hike interest rates well into 1991 citing real estate values, which were still in an appreciating mode. Interest rates were last seen at 7% in 1991, after which the BOJ quickly switched over to the easing camp and cut rates all the way to 0.5%. (see chart 3 below)
Chart 3
 Many monetarists and other well-meaning economists including Ben Bernanke are quick to dismiss the possibility of deflationary whirlwind storming the US economy in the 21st century. Their premise being so long as the Supply of Money is positive and made to rise continuously year over year, inflation and not deflation will be the natural consequence. While theoretically it sounds logical, empirical findings testify that pumping money and even more money may not produce the desired result of warding off deflation and depression
A peek into Japan between 1991 and 2001 reveals Money supply (M1) was made to rise in the 10 year period. Clearly refuting the monetarists claim, prices fell instead of rising and continue to this day.
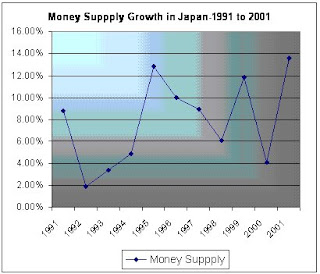
Apparently every attempt by the BOJ in the form of cutting key policy rates and easing liquidity through printing money proved fultile. As made evident by the chart 4 below, Japan’s GDP growth yo-yoed as it struggled to sustain year on year growth above 3%.
Chart 4

FINAL ANALYSIS
One of the most haunting questions in recent times has been whether the world’s largest economy would meet a similar fate as Japan. To answer this let us look at the following chart which puts together key ingredients of economic stagnation.
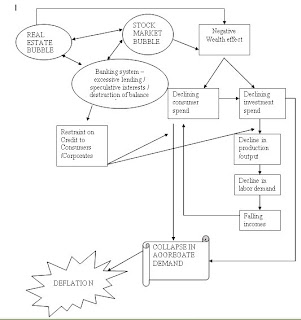
Interestingly it is worth noting that the genesis of a deflationary crisis, most often than not begins with asset bubble(s) coming apart.
Looking at the various dimensions of the crisis, it is amply clear that the current crisis of the US bears a striking resemblance to Japan in many ways. Only that the USA can boast of a crisis that is of a much higher order and magnitude - thanks partly to the financial weapon called securitization and the policies followed, which till date continue to reward the reckless and punish the innocent taxpayer and the rest of the world.
Very clearly the key to the solution lies not in an unprecedented pumping in of money but rather in the markets finding an important bottom-particularly the housing market. Until this happens, it is difficult to see any recovery sustaining itself. The recent housing statistics hardly offers a glimmer of hope.
As one who subscribes to the “stock market leading the economy” instead of the reverse mechanism, I believe that any breach of 7180 in the Dow will only serve to re-confirm the hypothesis that a repeat of the Japanese style collapse is indeed possible for the US economy. That said, any prospect of recovery could get muted if the current dollar appreciation continues.
For if two decades of stagnant growth was the price paid by the world’s (erstwhile) largest creditor for excessive risk taking, then the consequences of a similar crisis for a nation ridden with the largest debt can hardly be understated.
Nothing could capture better than the age old wisdom – People who earn their money tend to invest and spend it wisely and those who get an undeserved cheque tend to spend it less wisely or even lavishly. Interestingly the market, if left to itself will do just the opposite - reward the prudent and punish the reckless.
Two scenarios clearly emerge:
Best case scenario: Recovery seen in the US economy by 2H 2011. Global markets stage a reversal. Impact of interest rate cuts and other spending comes into play. ( to be noted : recovery in US need not necessarily translate into dollar strength as the market may choose focus on the unmatched deficits and punish the dollar )
Second Case scenario: The US enters into a phase of structural adjustment -one that is characterized by stagnant slow growth. In such a scenario, the US would hop in and out of recessions for at least 7-8 years, much like Japan.
Worst Case Scenario: If foreign appetite for US treasuries begins to wane then the stagnation could probably extend to 14-15 years.
I would reserve my pick for a combination of 2 and 3 (not by choice but by force) given the deep rooted nature of the current misfortune and the manner in which the US authorities are and will inflate the nation’s Balance Sheet
At the end of this structural adjustment, it is quite likely that the US will no longer be the driver of world growth. And while the economic hegemony of the US gives way and the US continues to stagnate, the rest of the world may actually grow stronger because Asia would do well in channelising its savings into its own domestic development rather than fund the United States of America.


